Making the Invisible Visible
Timeline:
2024
Hats Worn:
UX Design
UX Research
UI Design
Team:
1 Lead Designer
1 Product Owner
⚠️
Note: Some details have been adapted to respect confidentiality, but the case study reflects the real work and impact.
💡
The aim was to create the first platform built for non-STEM academics, where projects, people and resources could finally be visible in one place.

TL;DR / Quick summary
Non-STEM researchers often work in silos, with projects hidden and collaboration left to chance.
I led the end-to-end design of IVAS, a platform to make research visible, trusted, and easy to share. Over four months, I ran surveys, interviews and focus groups, mapped flows and architecture, and shaped a roadmap from MVP to long-term vision. The concept resonated, engaging 20+ institutions and 200 academics in early conversations.
👇
Scroll to read how IVAS turned scattered insights into a structured platform for collaboration.
The Context
In STEM fields, research is built around structures that naturally connect people. Labs, grants, and shared datasets create networks where projects and resources are visible. In non-STEM, that kind of infrastructure doesn’t exist. Most projects are carried out by small groups or individuals, often working in parallel across different universities, with little consistency in how or where their work is shared.
This creates a landscape where valuable knowledge is everywhere and nowhere at the same time. Some of it sits on university servers with restricted access, some on personal drives, some in conference papers that never leave a niche audience. Even when work is published, it is often locked behind paywalls or disconnected from the practical resources that other researchers need. There is no central place where academics can see what is already happening in their field.
I kept hearing the same thing in conversations with researchers. Collaboration did happen, but it was accidental. Early-career researchers in particular felt the limits of this. They wanted to contribute, but without visibility they were often starting from scratch, unaware that others had already done similar work. Institutions felt the strain too, with teams in different places duplicating projects instead of building on each other’s progress.
What struck me most was that this wasn’t about willingness. People wanted to collaborate. The challenge was that the system gave them no way to see each other. In non-STEM, collaboration depended on luck.
Through surveys and interviews, the same challenges kept surfacing. Researchers described how difficult it was to discover relevant projects, resources, or even peers working in the same area. Without a shared space, they relied on word of mouth or long searches across multiple repositories, often without knowing if what they eventually found was the most current or useful version.
Another issue was transparency. Even when projects were visible, researchers struggled to understand their real value. Without this context, people hesitated to trust or build on the work.
Collaboration itself was fragile. Some participants admitted that they avoided reaching out because the effort felt greater than the potential reward. There was no clear structure for contributing resources or sharing progress, which meant the responsibility for collaboration always fell on individuals rather than the system supporting them.
These patterns had consequences beyond individual frustration. Promising work stayed local instead of being built upon. Resources were created in silos, sometimes replicated across different institutions. Early-career researchers spoke about feeling isolated and unsupported, while leaders noted how difficult it was to measure the collective impact of their departments.
What stood out to me was how interconnected these issues were. Discoverability was about the trust in what you found. Transparency was about whether people felt confident enough to contribute in the first place. And collaboration was about whether the system itself made sharing feel natural instead of like extra labour.
In other words, the problem wasn’t a single point of friction that could be solved with a tool. It was a cycle:
→ Limited visibility made discovery harder → Limited context reduced trust → And without trust, people had little motivation to collaborate.
The Challenge
The real test was whether we could design something that made projects visible, gave them context, and actually motivated people to share.
The challenge for me was to turn that ambition into something real. In four months, I had to take the project from research to an MVP that could prove the concept and set the foundation for future growth.
My Role
I was the only designer on IVAS, which meant there was no room to hide. Research, surveys, interviews, personas, competitor analysis, flows, information architecture, every part of the process landed on my desk.
I worked directly with the founder. We shaped the vision together, sometimes in broad strokes, sometimes in long working sessions where we pulled ideas apart and tried to put them back together. Having no layers between me and the decision-maker meant speed, but it also meant responsibility. Every choice mattered because it shaped the product from the ground up.
On the research side, I designed and ran surveys, followed them up with interviews and focus group discussions, and built out personas that became more than just a design tool. In a startup with no team beyond us, those personas were the product brief, the pitch deck, and the north star all at once. They carried weight because they made the invisible audience visible.
On the design side, I mapped user journeys for both academics and institutions, knowing that each had very different needs. I structured the platform into groups, projects, interests and skills, and built the roadmap that split work into what we could prove in an MVP, what could come later, and what was part of the long-term vision.
What stood out to me during this project was how much being the sole designer changes the role. You’re not just sketching flows or drafting wireframes. You’re holding the problem, the research, the vision and the roadmap all in one place. Some days it felt like a lot, but it also taught me how to move between those levels without losing sight of the bigger picture.
Research plan and scope
I treated this like a 0 to 1 product. Step one was framing the right questions. The plan split into three streams that ran in parallel and fed into each other: a broad survey to map the landscape, depth interviews to understand behaviour and language, and an environmental scan to see what already existed across academia and adjacent spaces.
Survey — mapping the landscape
Goal - Get a clear picture of how people currently discover projects and resources, where the bottlenecks are, and what “good” would look like to them.
Who - A mix of early‑career researchers, established academics, and a small number of professional services staff across different institutions and disciplines in the humanities and social sciences.
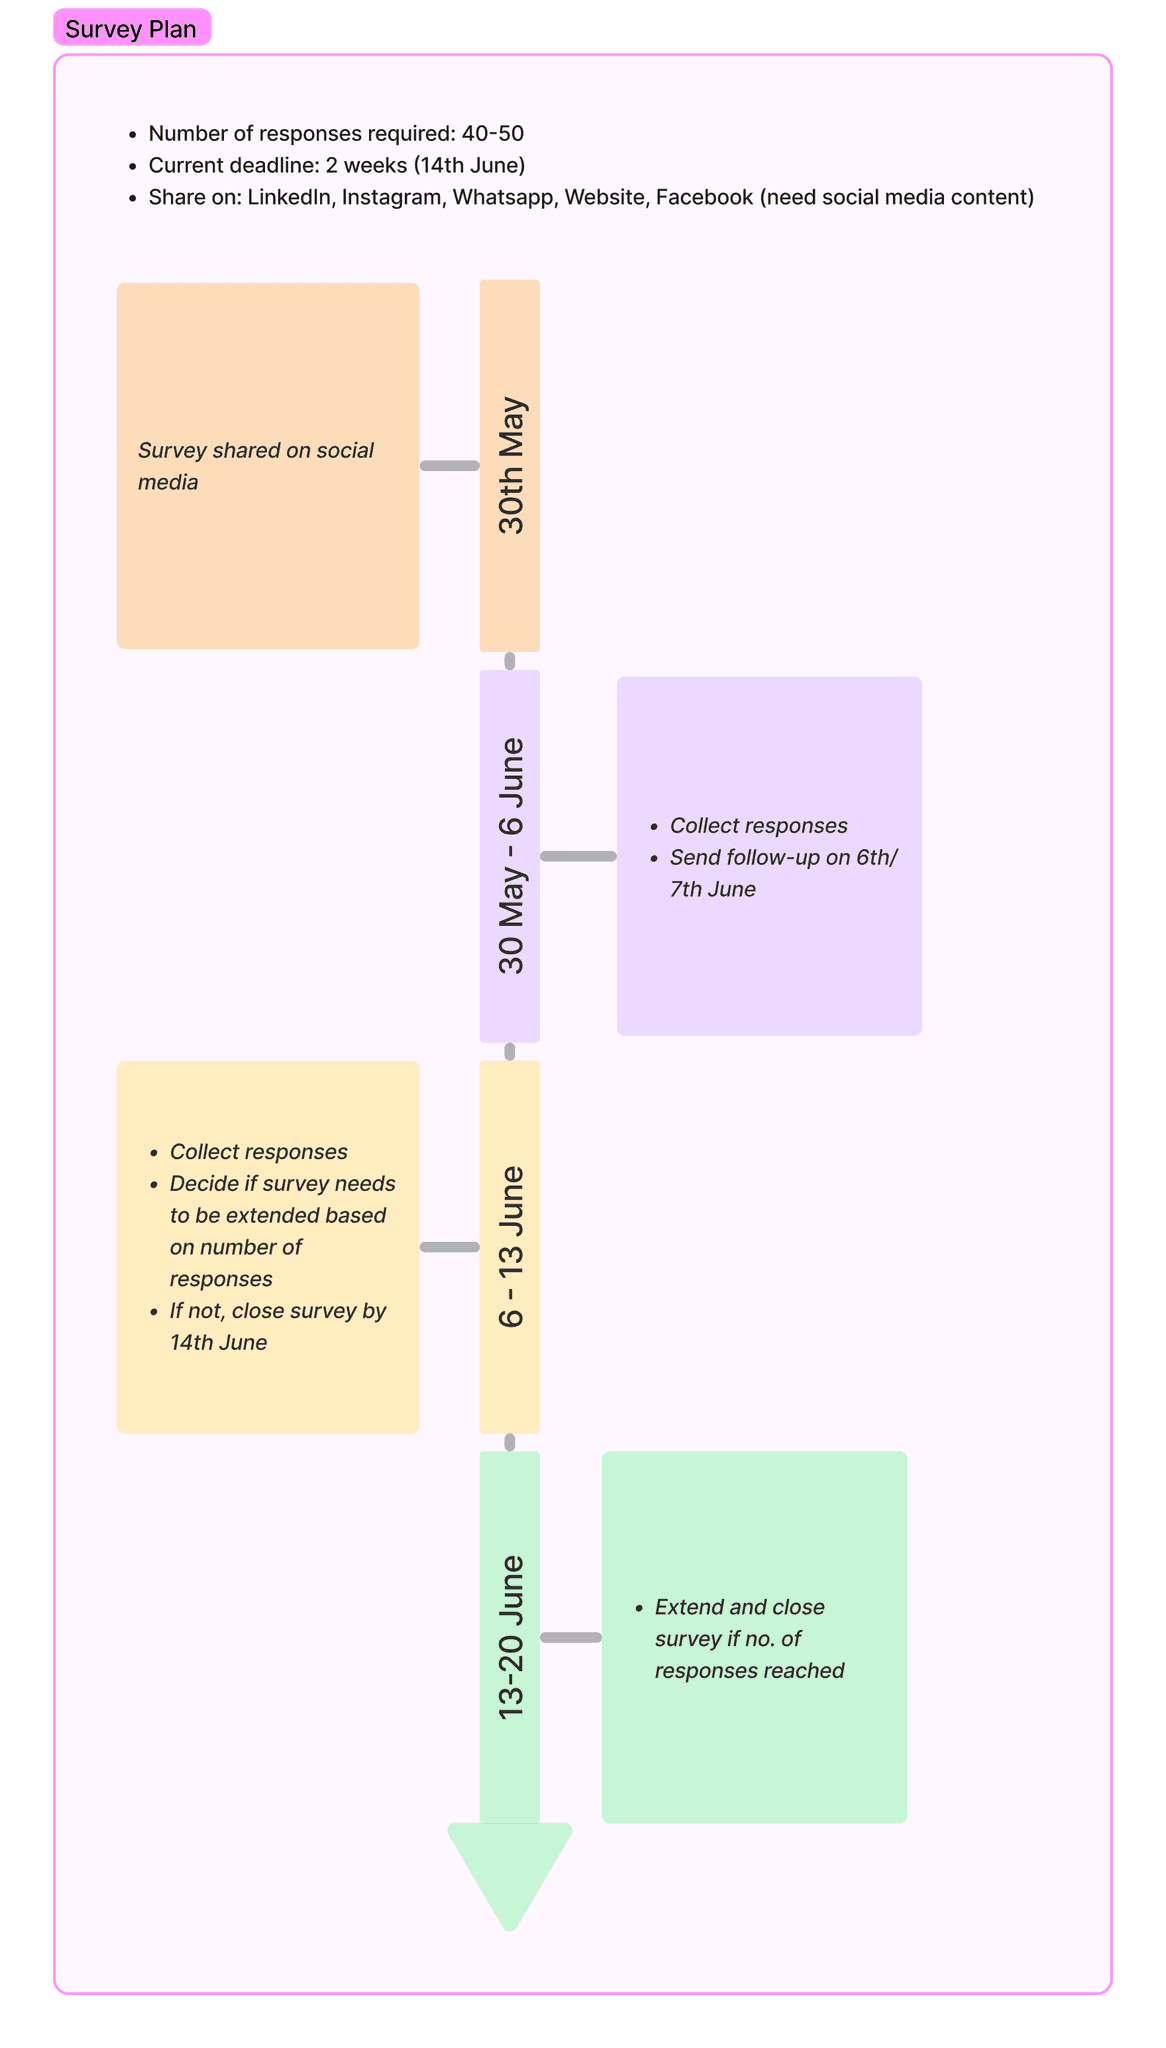
A high-level overview of the survey plan we created
Instrument:
Screening questions to capture role, career stage, institution type and discipline.
Discovery workflow: where do you look first, how many places do you check, how often do you abandon a search.
Trust and context: what signals make you confident enough to reuse a resource or join a project.
Collaboration behaviour: when do you reach out, what stops you, what helps.
Open questions for stories about “the last time you tried to find X” and “a time you discovered duplication.”
What stood out:
People zig‑zag between institutional repositories, personal folders, colleagues, and conference proceedings.
The same blockers kept appearing: not knowing if something already exists, not knowing whether it is current, and not knowing who to talk to.
“Proof” matters. Credits, recency, endorsements and usage all act as confidence signals. Without them, people hesitate.
Interviews — language, habits, and the “why”
Goal - Understand the human side behind the survey data. What actually happens when someone tries to find a collaborator or a resource. What makes them give up. What finally moves them to act.
Format - Semi‑structured one‑to‑ones, 45–60 minutes, remote. I used task‑based prompts like “walk me through the last time you looked for a data set or literature review to build on” and “show me where you keep your current project materials.”
Patterns:
People do collaborate, but it is relationship‑led. Discovery rarely starts from a shared system.
“I do not know who to ask” and “I am not sure this is the latest version” came up a lot.
Early‑career researchers wanted visibility as much as they wanted resources. Being seen unlocks invitations.
Senior academics cared about credit, citation, and reputational risk. If context is thin, they will not attach their name.
Professional staff wanted lightweight ways to see activity across departments without becoming gatekeepers.
Verbatim tone I designed for:
“I am probably recreating something, but I cannot find it.”
“If I cannot tell who stands behind this, I avoid using it.”
“I will reach out if it is clear how to contribute. If not, I leave it.”
Environmental scan — what exists and where the gaps are
Beyond speaking to people, I mapped the existing landscape. I reviewed university repositories, funding portals, and academic networking tools. Each had some value, but none were built for cross-institution visibility in the humanities and social sciences. Most tools were either too generic, designed for any kind of networking, or too narrow, locked within one institution or funding stream.
This reinforced the idea that the gap wasn’t just a lack of technology. It was a lack of a system designed for the way non-STEM researchers actually work: independently, across scattered institutions, and with fewer built-in mechanisms for sharing.
Competitor Analysis
I also studied existing research collaboration platforms. They tended to focus on STEM fields, where structured funding and lab networks already give researchers a reason to share. The workflows reflected that context: heavy emphasis on data, grant calls, and lab-led projects.
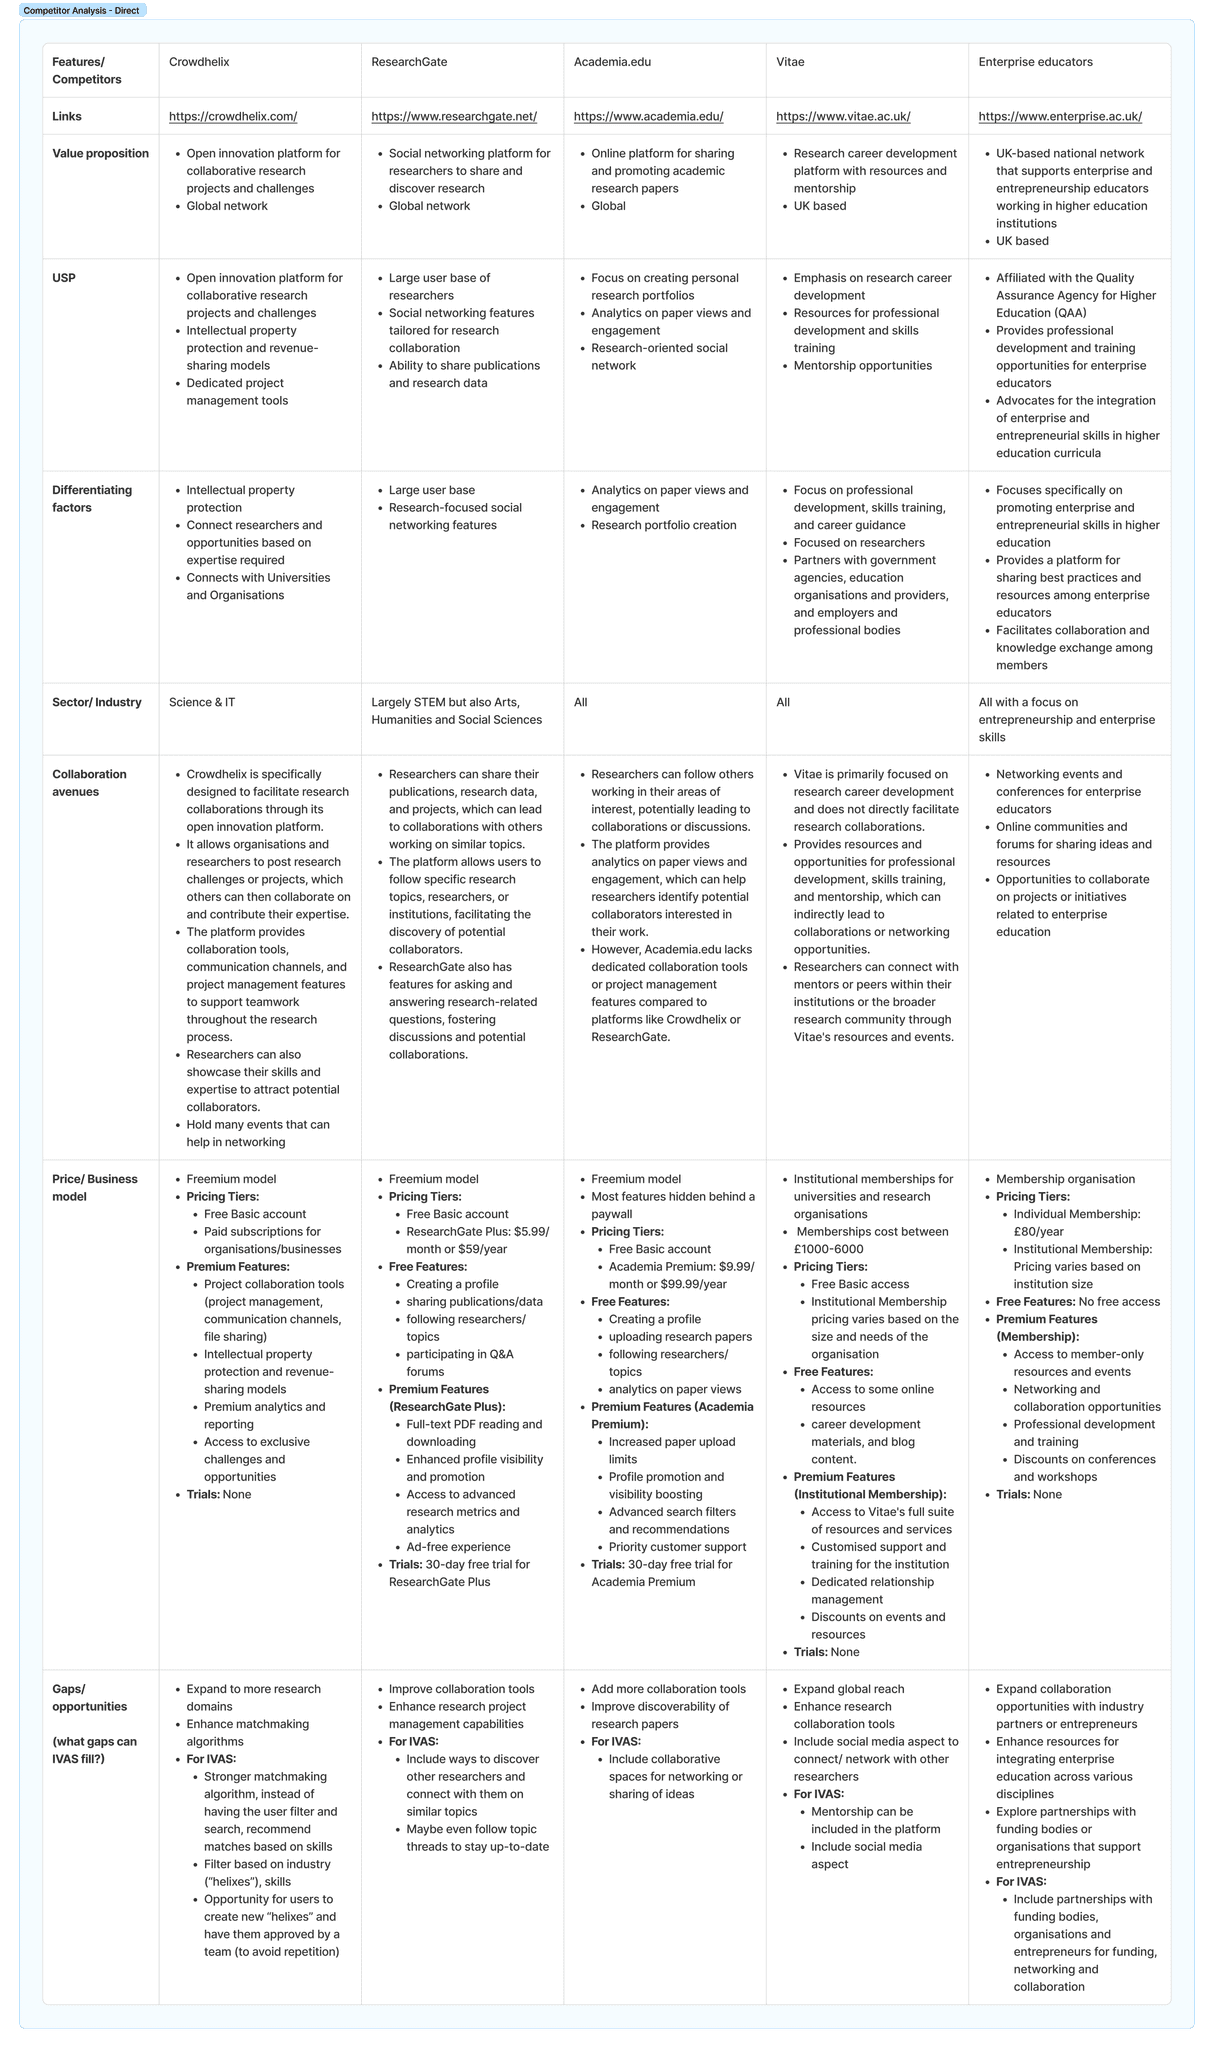
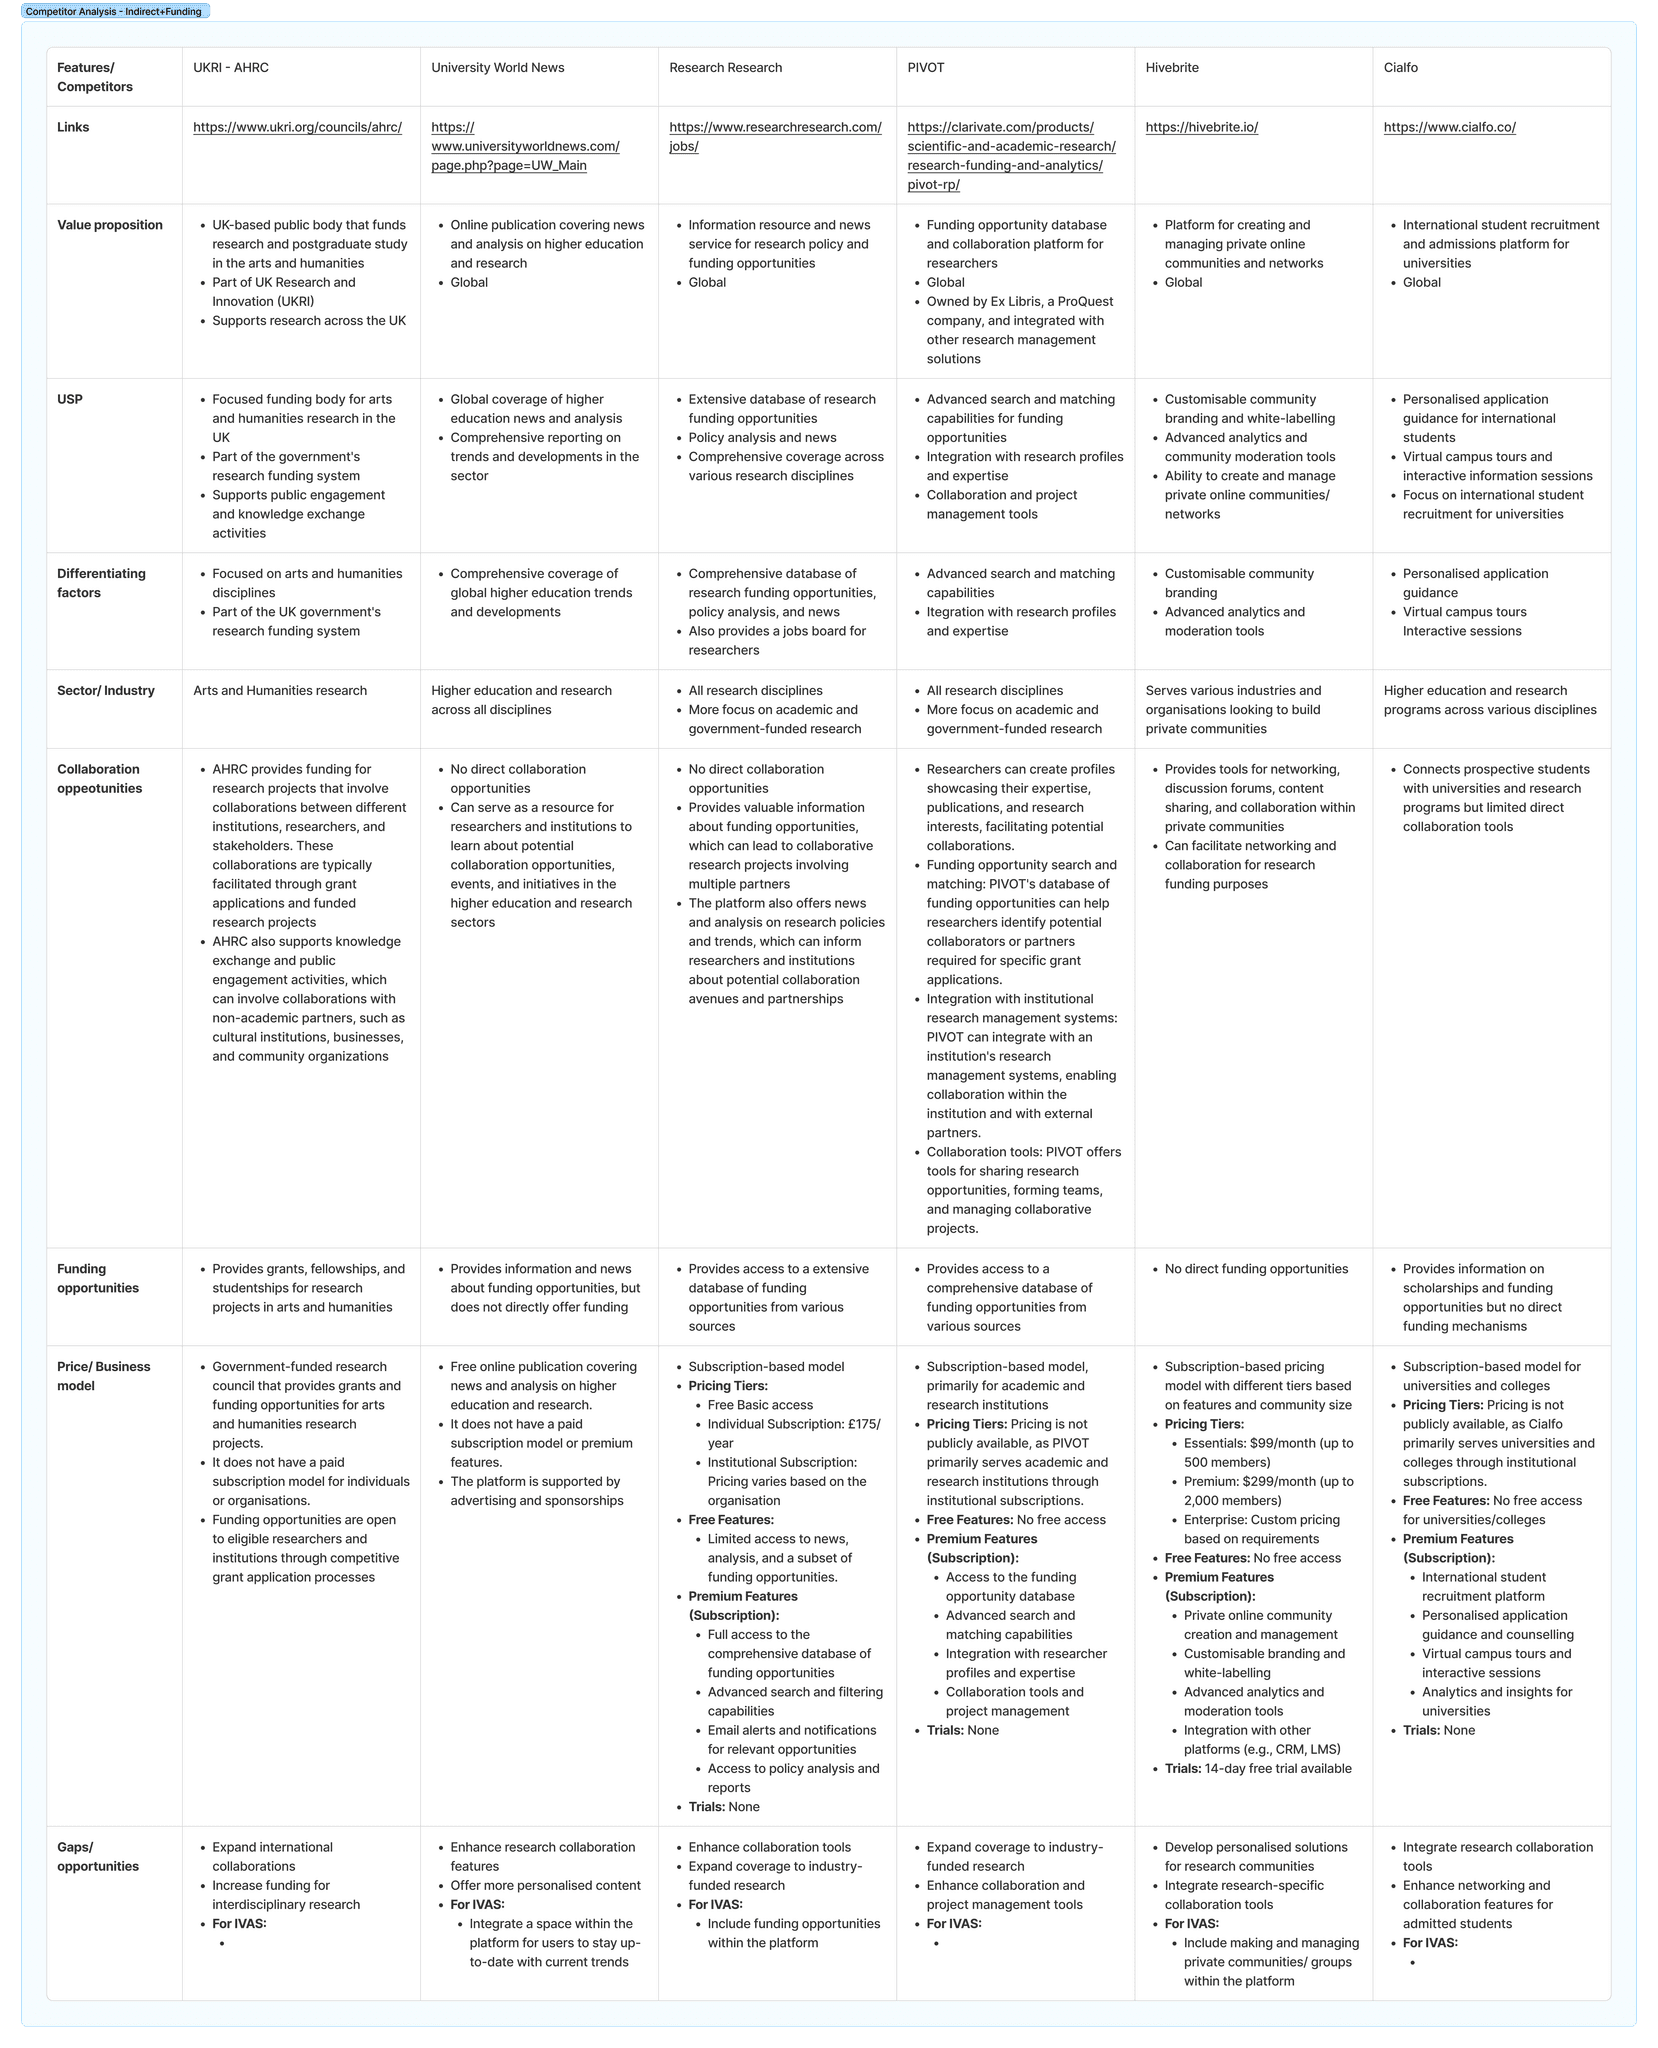
The super-comprehensive competitor analysis I did for both B2B and B2C user groups
What set IVAS apart was its focus on non-STEM. These disciplines had no equivalent platform, and the needs were different. Instead of data-heavy integration, researchers needed visibility of who was doing what, confidence that the work could be trusted, and light-weight ways to connect without bureaucratic overhead.
This competitor review gave me two things. First, it validated that platforms like this could succeed, because they already did in other fields. Second, it showed that simply copying their model would not work for IVAS. The design had to reflect the specific needs and culture of non-STEM academics.
Synthesis
Once the surveys, interviews, focus groups and desk research were done, I pulled everything into one wall and started clustering. Patterns jumped out quickly. People weren’t struggling because they lacked tools. They were struggling because they couldn’t see what already existed, they couldn’t trust what they found, and they didn’t feel confident that sharing their work would be worth it.
Discoverability
The number one theme was discovery. Researchers described hopping between drives, repositories, colleagues, and conferences just to check if something already existed. Half the time they still weren’t sure.
“I’m probably recreating something, but I can’t find it.”
It was obvious that search alone wasn’t enough. The system had to reflect how academics actually think about their work, with the right metadata and structure to make things surface at the right time.
Transparency and Trust
Visibility without trust meant nothing. Even if they did find something, the first question was always: who made this, is it current, has anyone else used it? Without those signals, people hesitated. Senior academics especially didn’t want to put their name next to work that felt unverified.
“If I can’t tell who stands behind this, I avoid using it.”
The platform needed visible ownership, recency, and endorsements that gave people confidence straight away.
Collaboration Dynamics
Collaboration came up in focus groups, and it was clear how fragile it was. People said they’d only reach out if the process was simple and the value obvious. Otherwise they just left it.
“I’ll reach out if it’s clear how to contribute. If not, I leave it.”
Goodwill wasn’t enough. The system itself had to make sharing easy and give people reasons to do it.
Early-Career Researchers
ECRs were the most vocal. They didn’t just want access to projects. They wanted their own work to be visible. Being seen meant invitations, which meant career opportunities. Without visibility, they stayed isolated, stuck repeating work instead of joining bigger conversations.
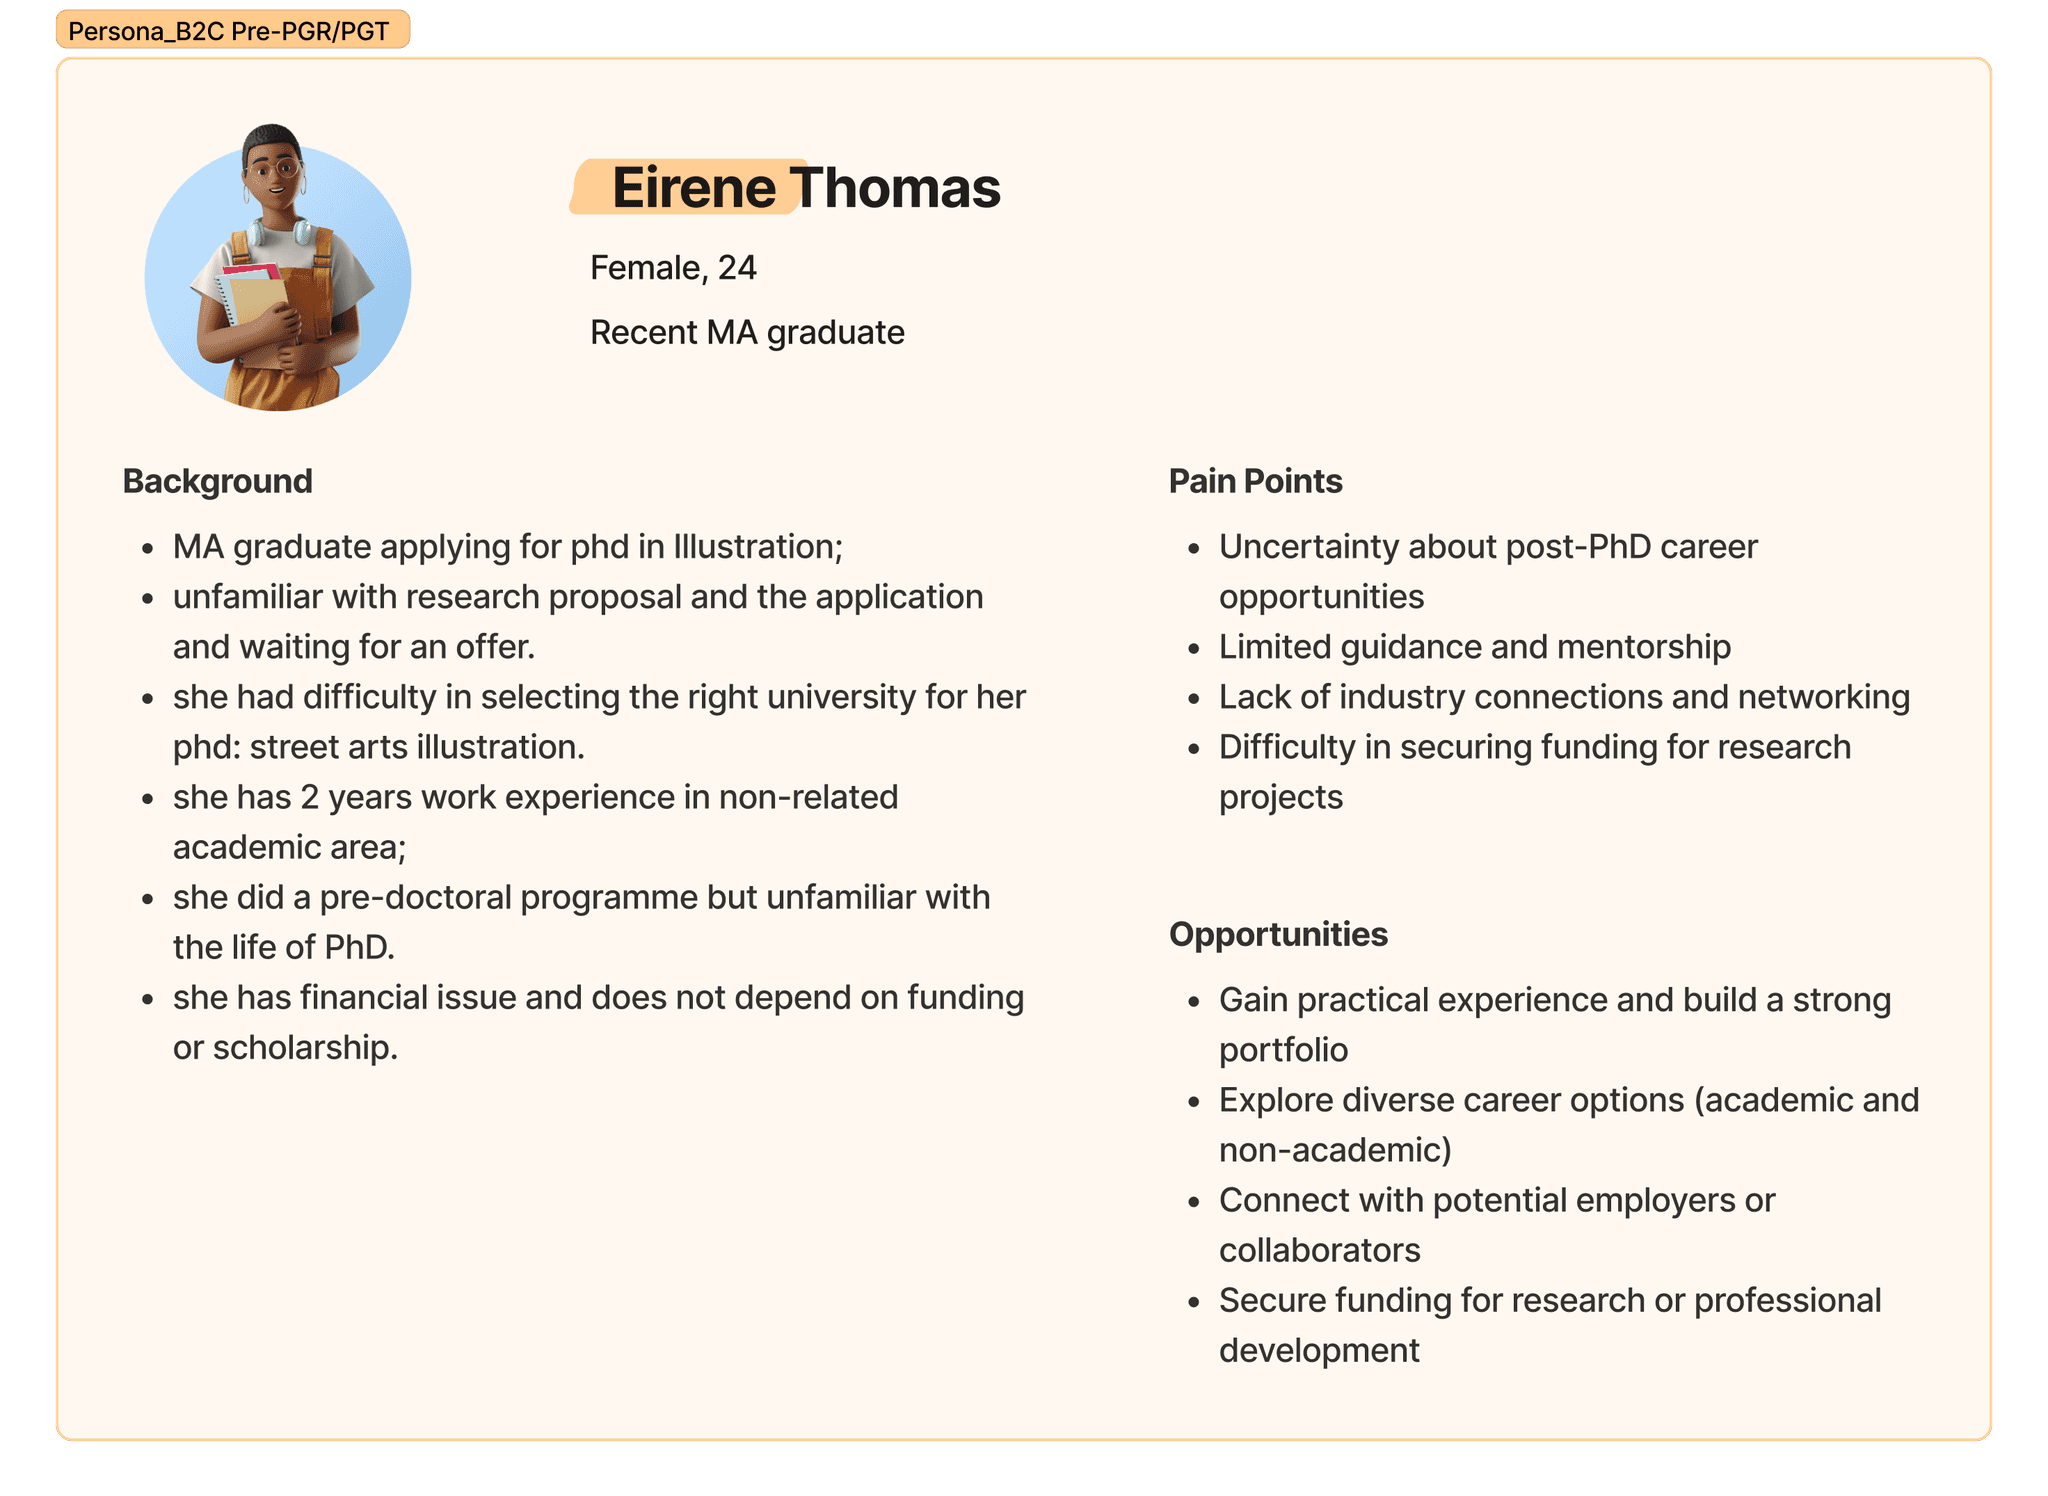
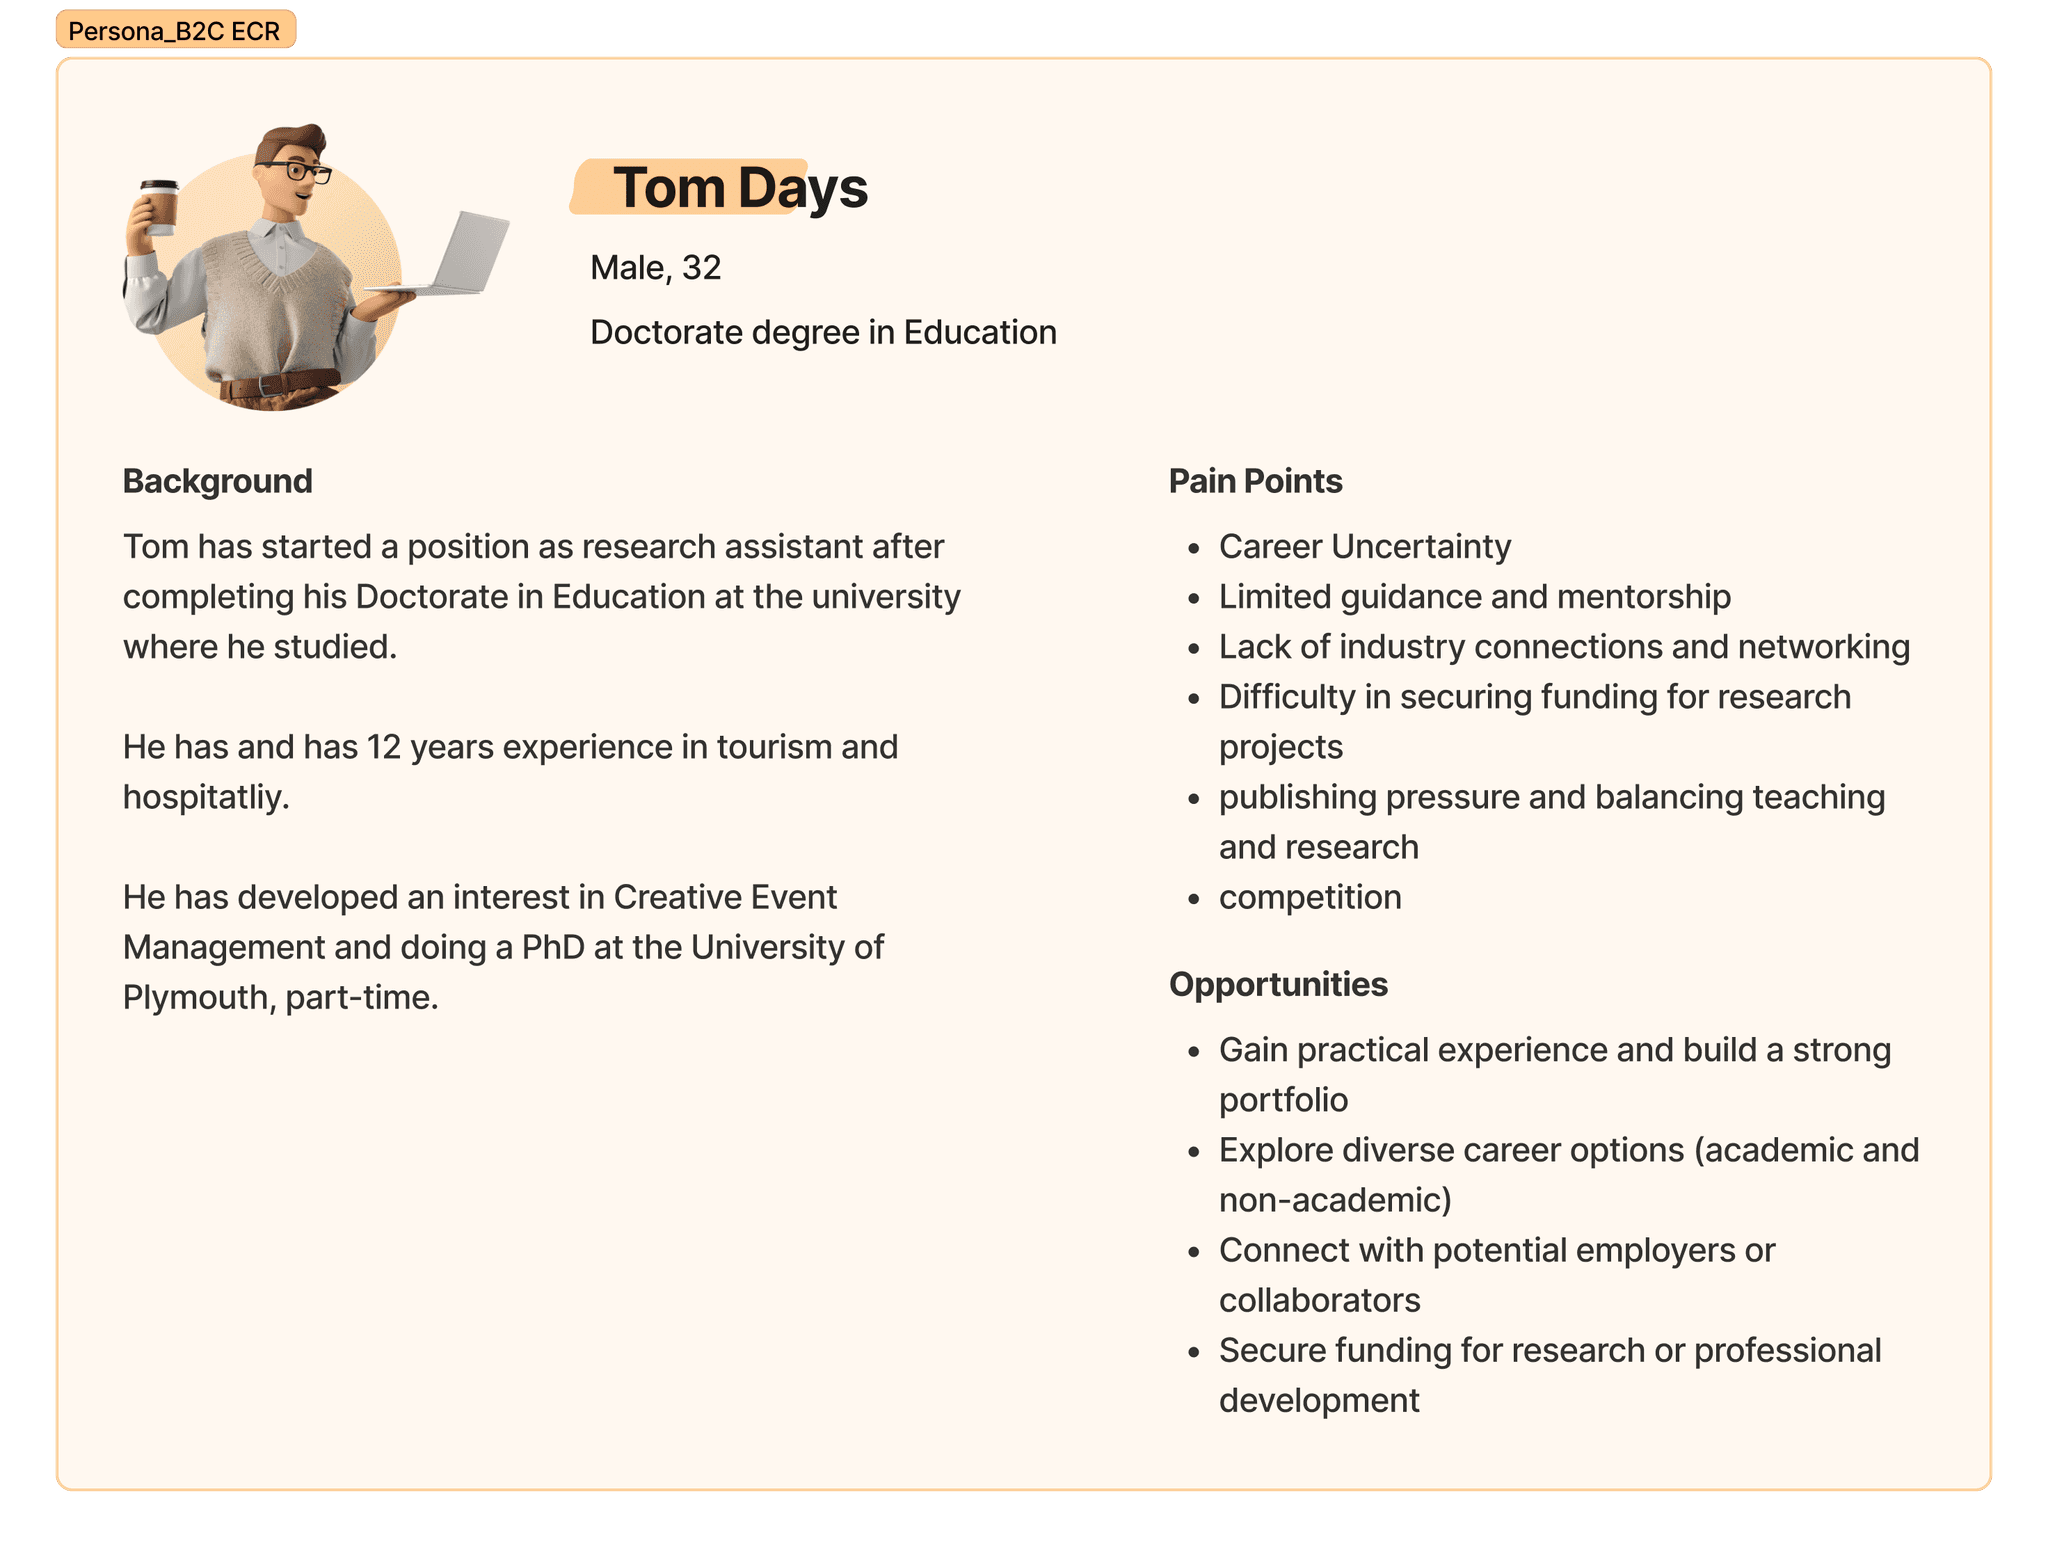
The B2C personas I created based on insights from the primary research
institutions
Leaders and staff described how little oversight they had. They couldn’t see activity across departments without chasing people for reports. Duplication happened at scale, and impact was hard to prove. An institutional view was just as important as an individual one.
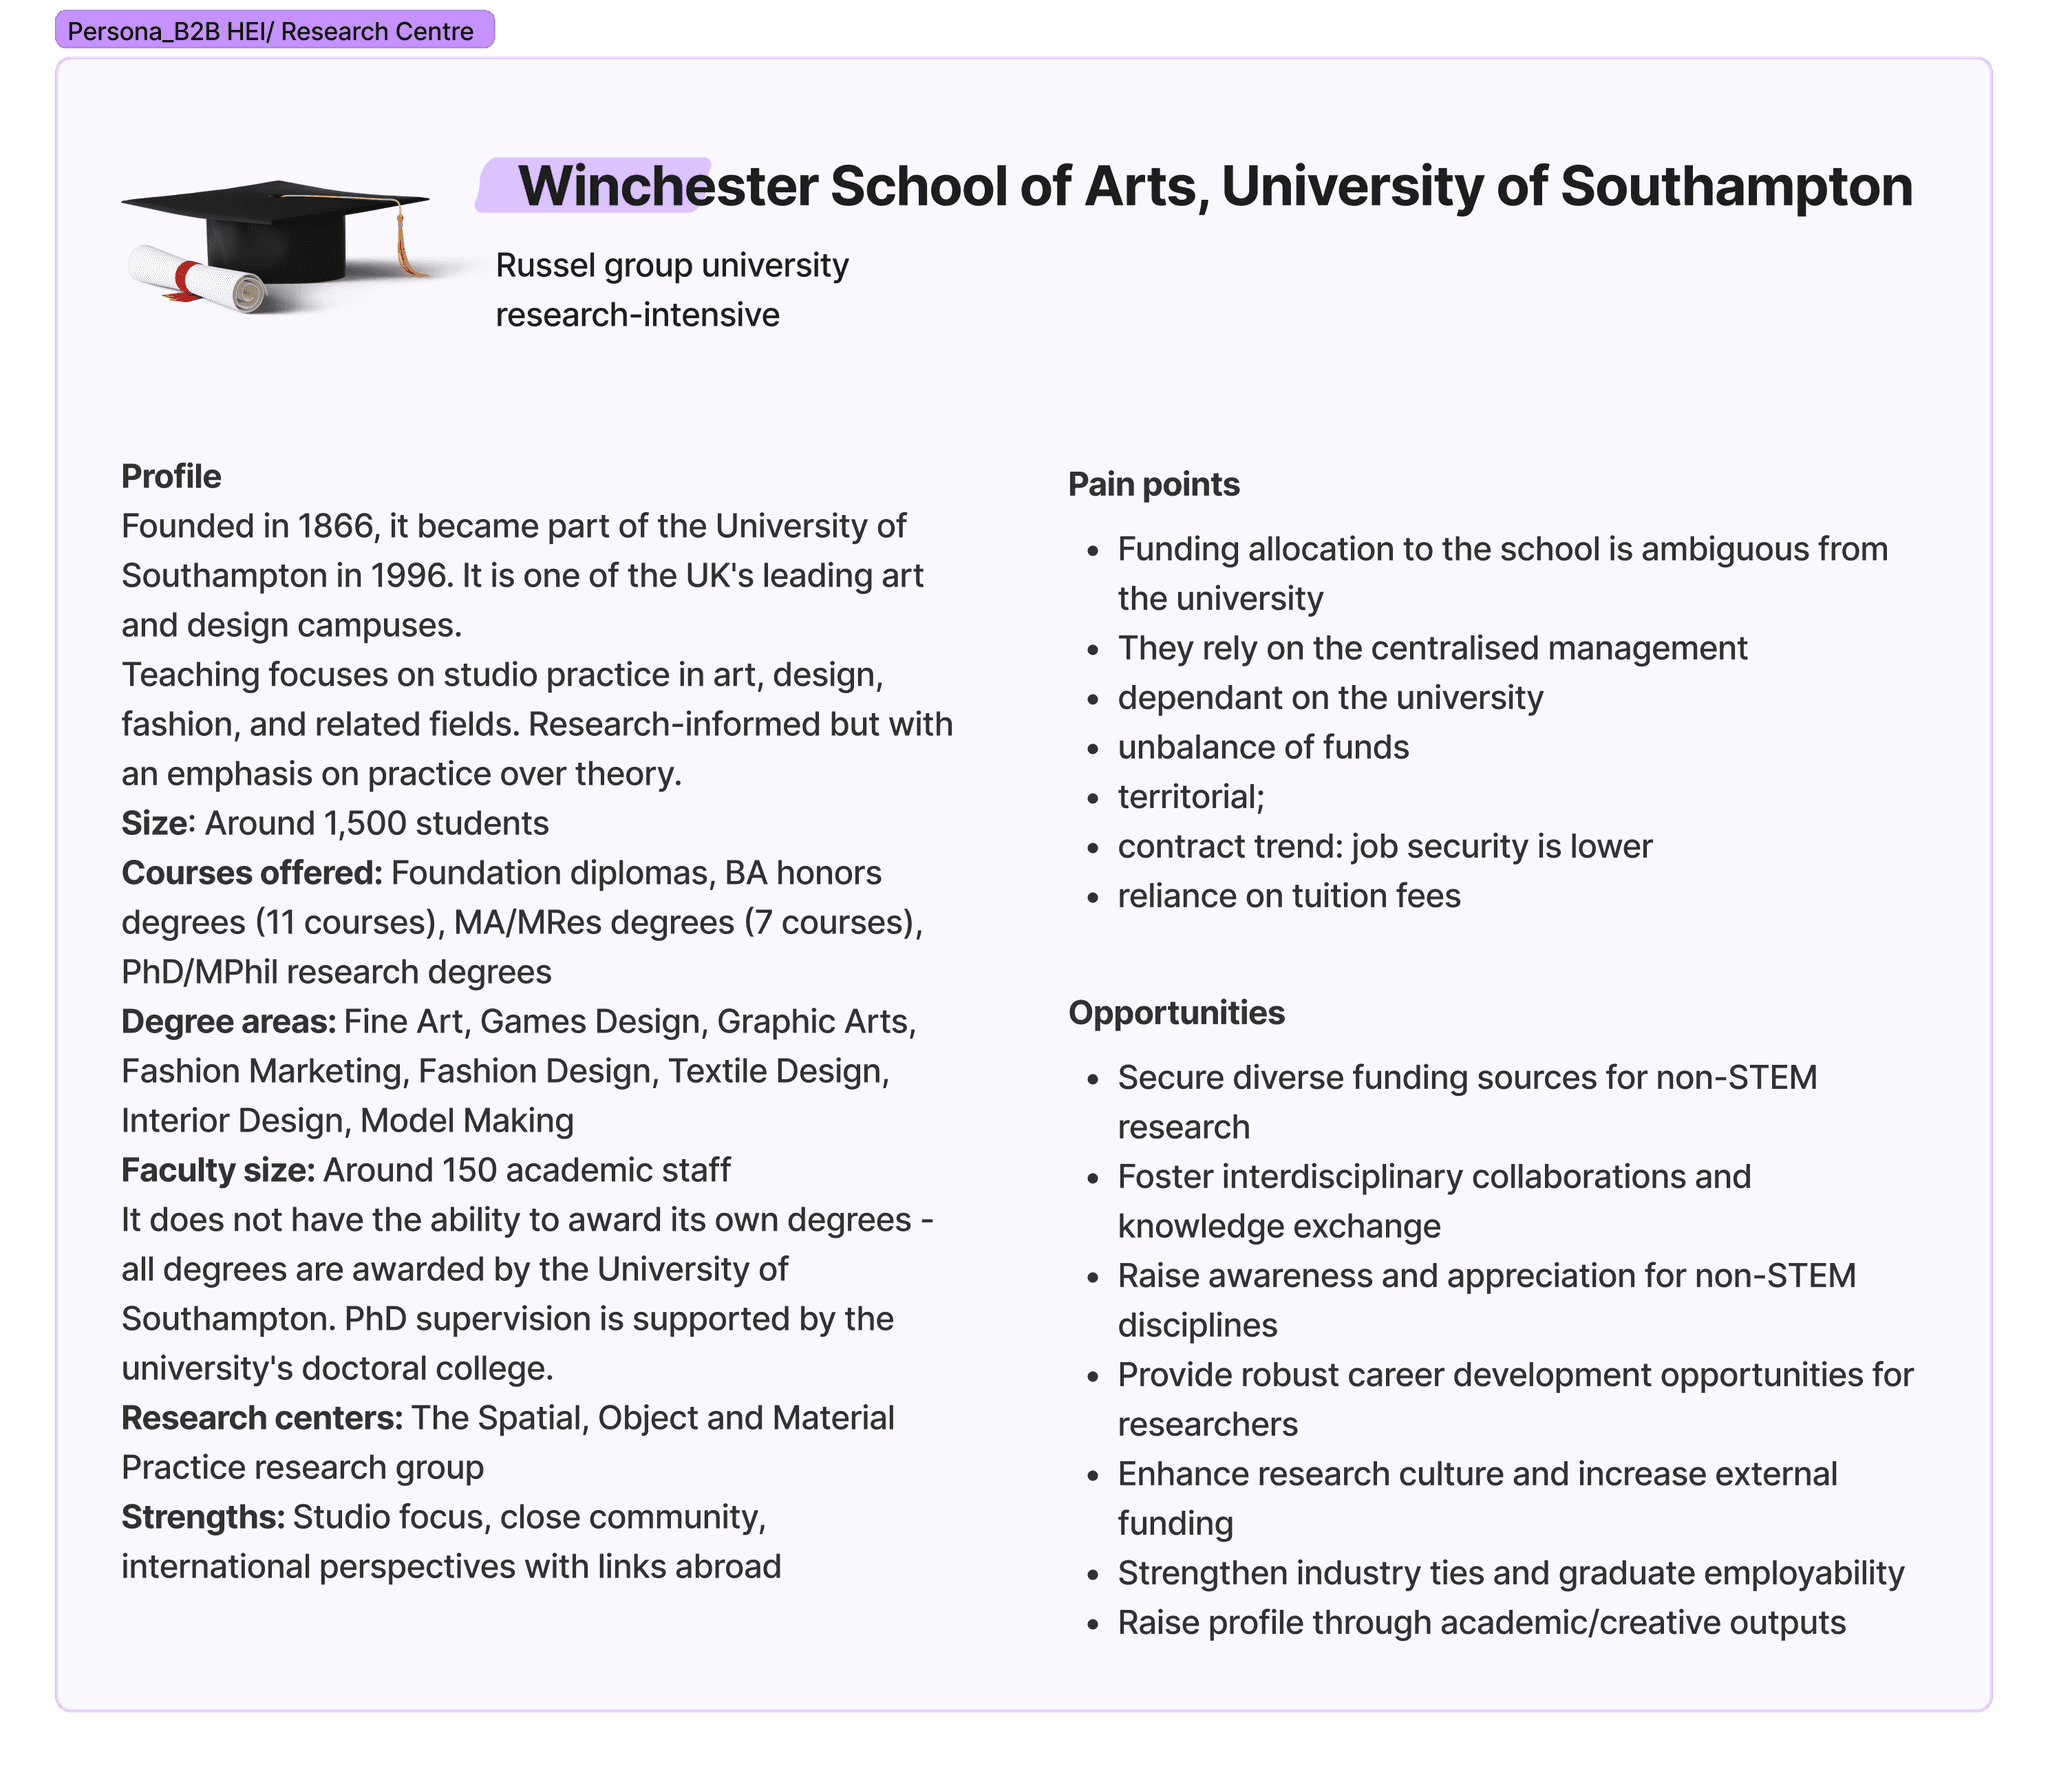
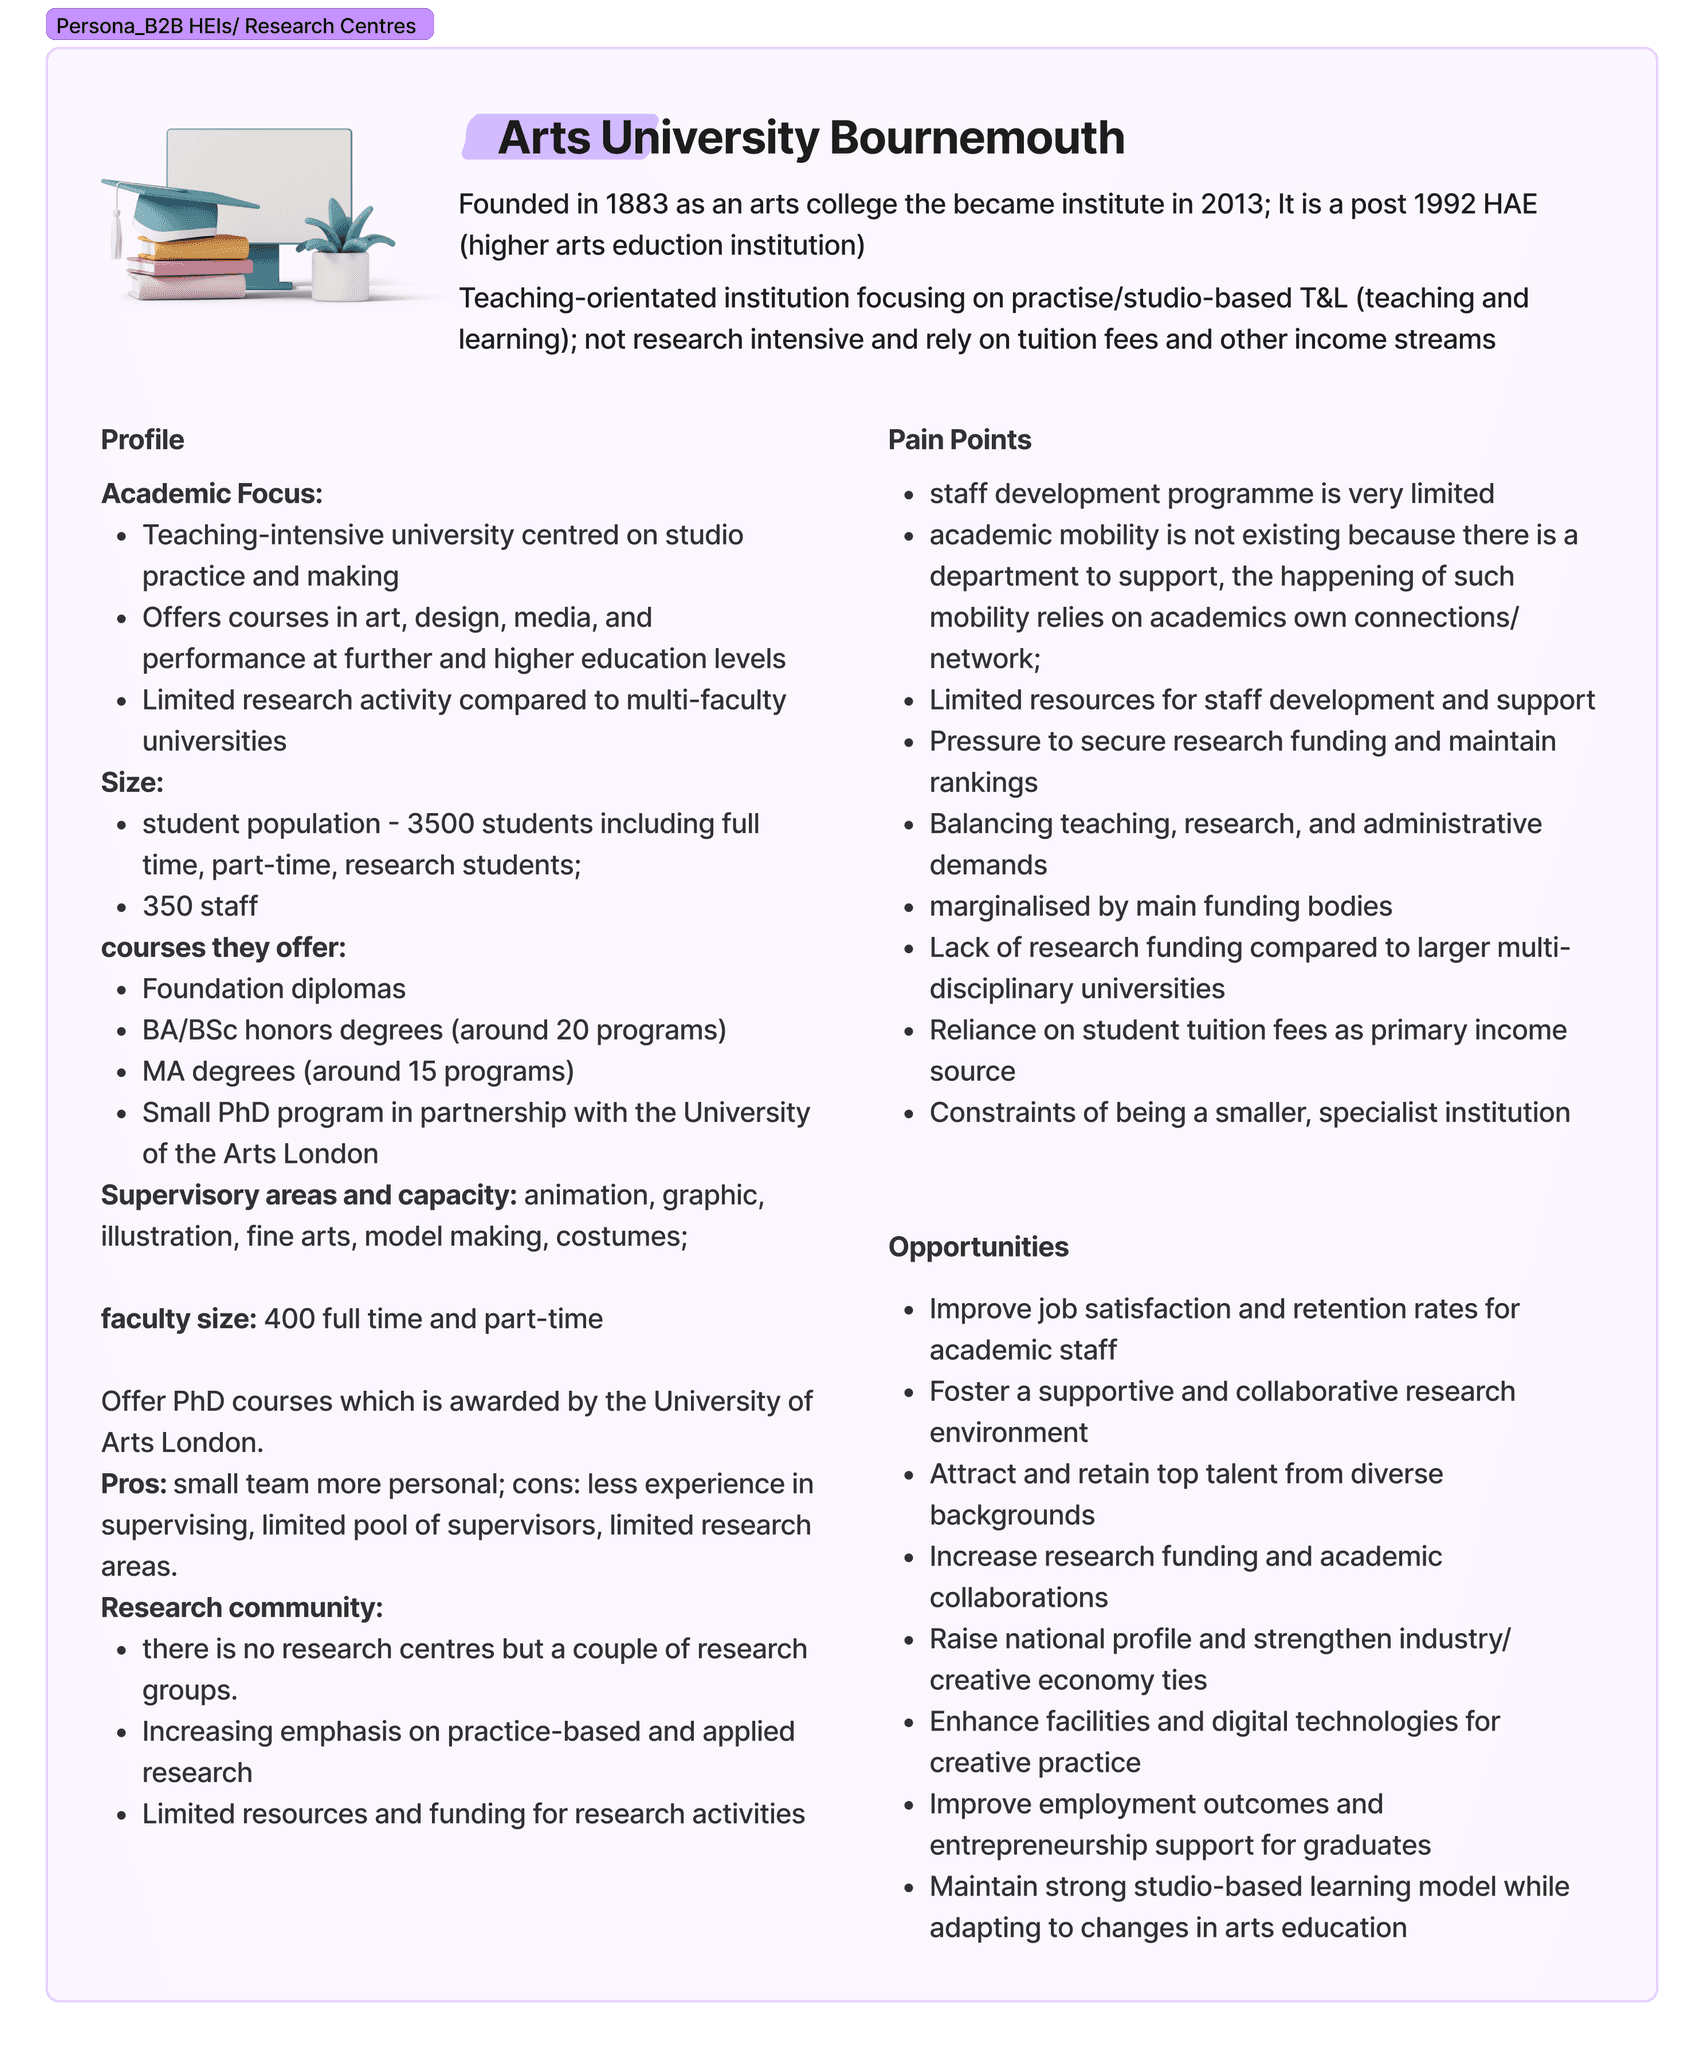
The B2B personas I created based on insights from the primary research
What tied everything together was how connected these problems were. Poor visibility made discovery hard. Weak context killed trust. Without trust, people didn’t share. And if nobody shared, there was nothing to discover.
👉
Breaking that cycle became the design challenge. The platform had to make it easy to see, easy to trust, and easy to contribute — and make each of those feed into the next.
The research didn’t just give me themes. It gave me a way to think about people on the platform. I turned the insights into mindsets — not just static personas, but ways people approached collaboration.
There were the Explorers, curious but often without a clear starting point. Collaborators, who thrived on sharing but got stuck when there was no system to support it. Self-learners, who wanted to dig in alone but still needed access to trusted resources. Leaders, who wanted the big picture of adoption and impact. And the Aware, those who needed enough context to make confident choices before committing.
Each mindset connected directly back to a design theme.
The platform had to be discoverable. Researchers needed to know something existed without digging through five different places.
It had to be transparent. Every project and resource needed ownership, recency, endorsements, and context built in.
It had to feel seamless. Contribution flows had to be simple enough that adding or endorsing didn’t feel like admin.
And it had to be rewarding. People needed to see value in contributing — whether that was visibility, credit, or invitations to collaborate.
Flows
Designing the flows was about turning the research insights into something practical that matched how people actually work. I mapped two core journeys side by side: the individual researcher flow and the institutional flow.
Researcher Flow (B2C)
Discover — Start with a search or browse by interest/skill. Results surface projects with metadata like owner, last updated, endorsements, and related outputs.
Evaluate — Decide whether the project is relevant using those context signals. Is it current? Is the creator credible? Has anyone endorsed it?
Join or Reuse — If useful, the researcher can join the project, request collaboration, or reuse resources directly.
Contribute — Add their own resources, upload artefacts, share progress, or endorse existing work.
Visibility & Credit — Every contribution updates their profile, builds their reputation, and makes them more discoverable to others.
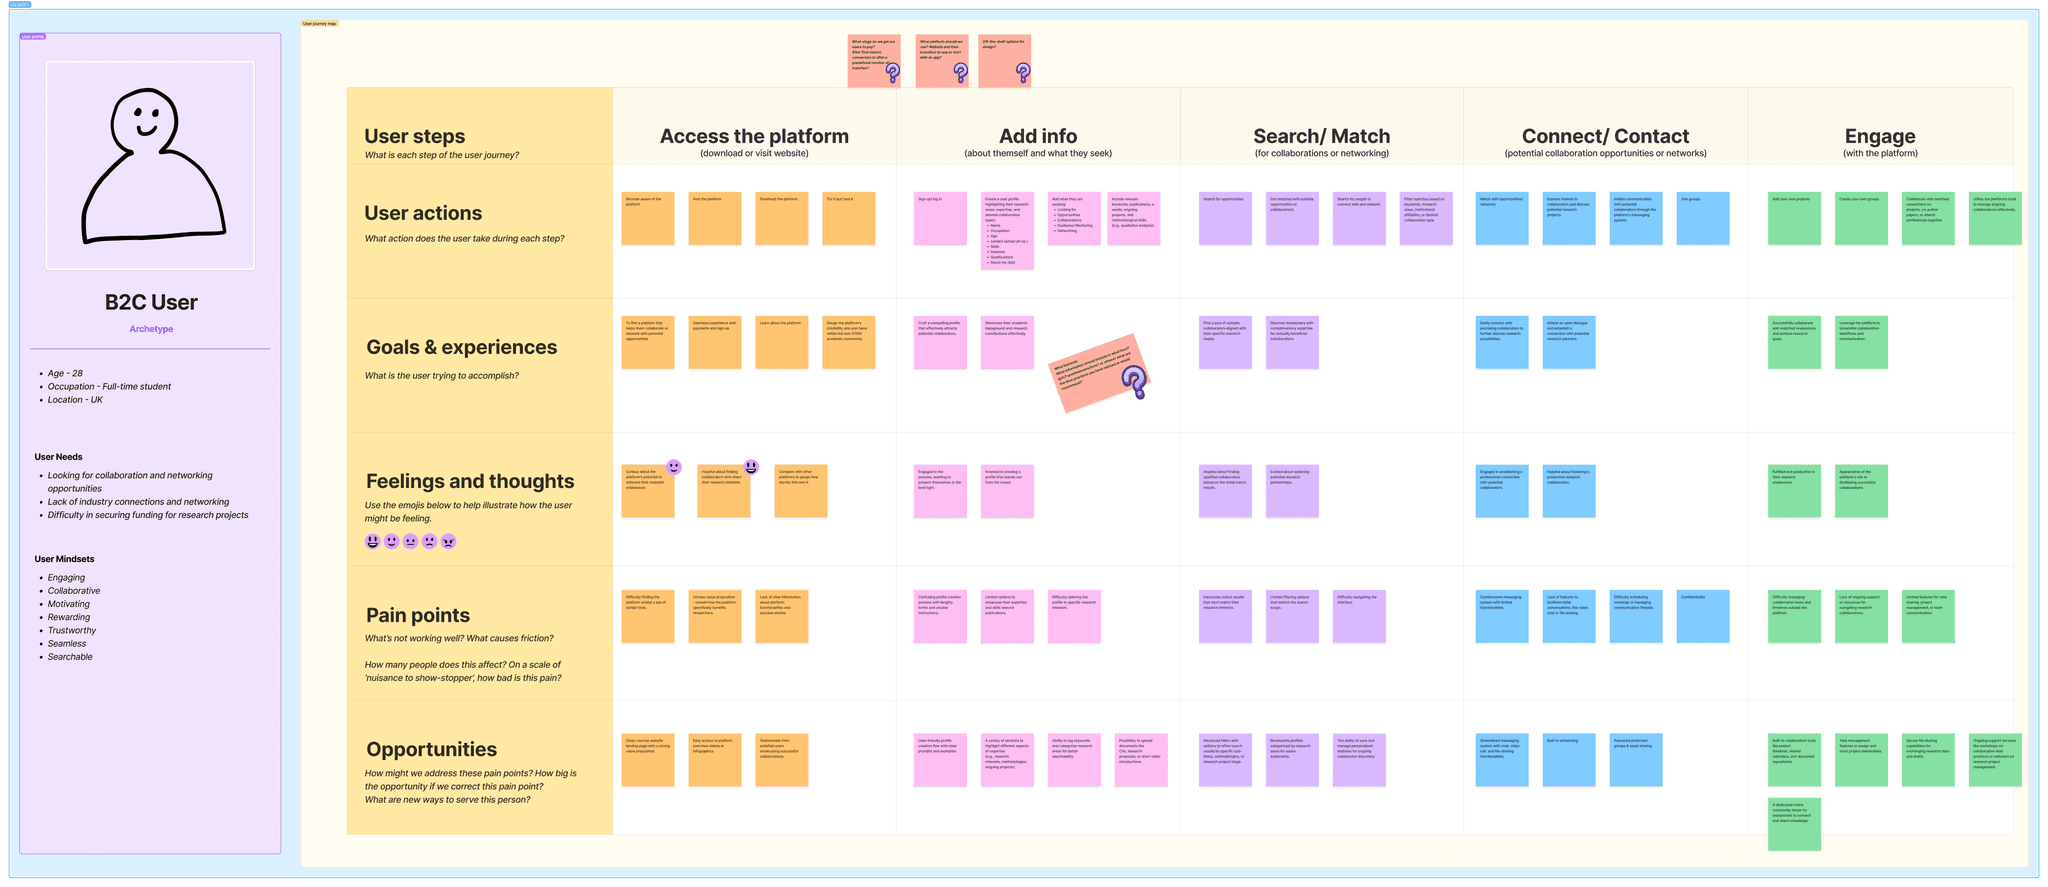
The B2C journey map that captured how they would interact with the platform
This flow directly addressed the cycle I saw in research: visibility → trust → contribution → more visibility.
Institutional Flow (B2B)
Create Presence — An institution sets up a group, adds departments, and connects staff.
Validate Projects — Institutions can add light-touch approvals or tagging, helping ensure projects surfaced with credibility.
See Activity — View an aggregated dashboard of projects and collaborations across their departments.
Report Outcomes — Export metrics like adoption, engagement, and collaborations for funding bids or internal reviews.
Promote Success — Highlight projects that showcase impact, attracting more researchers to join.
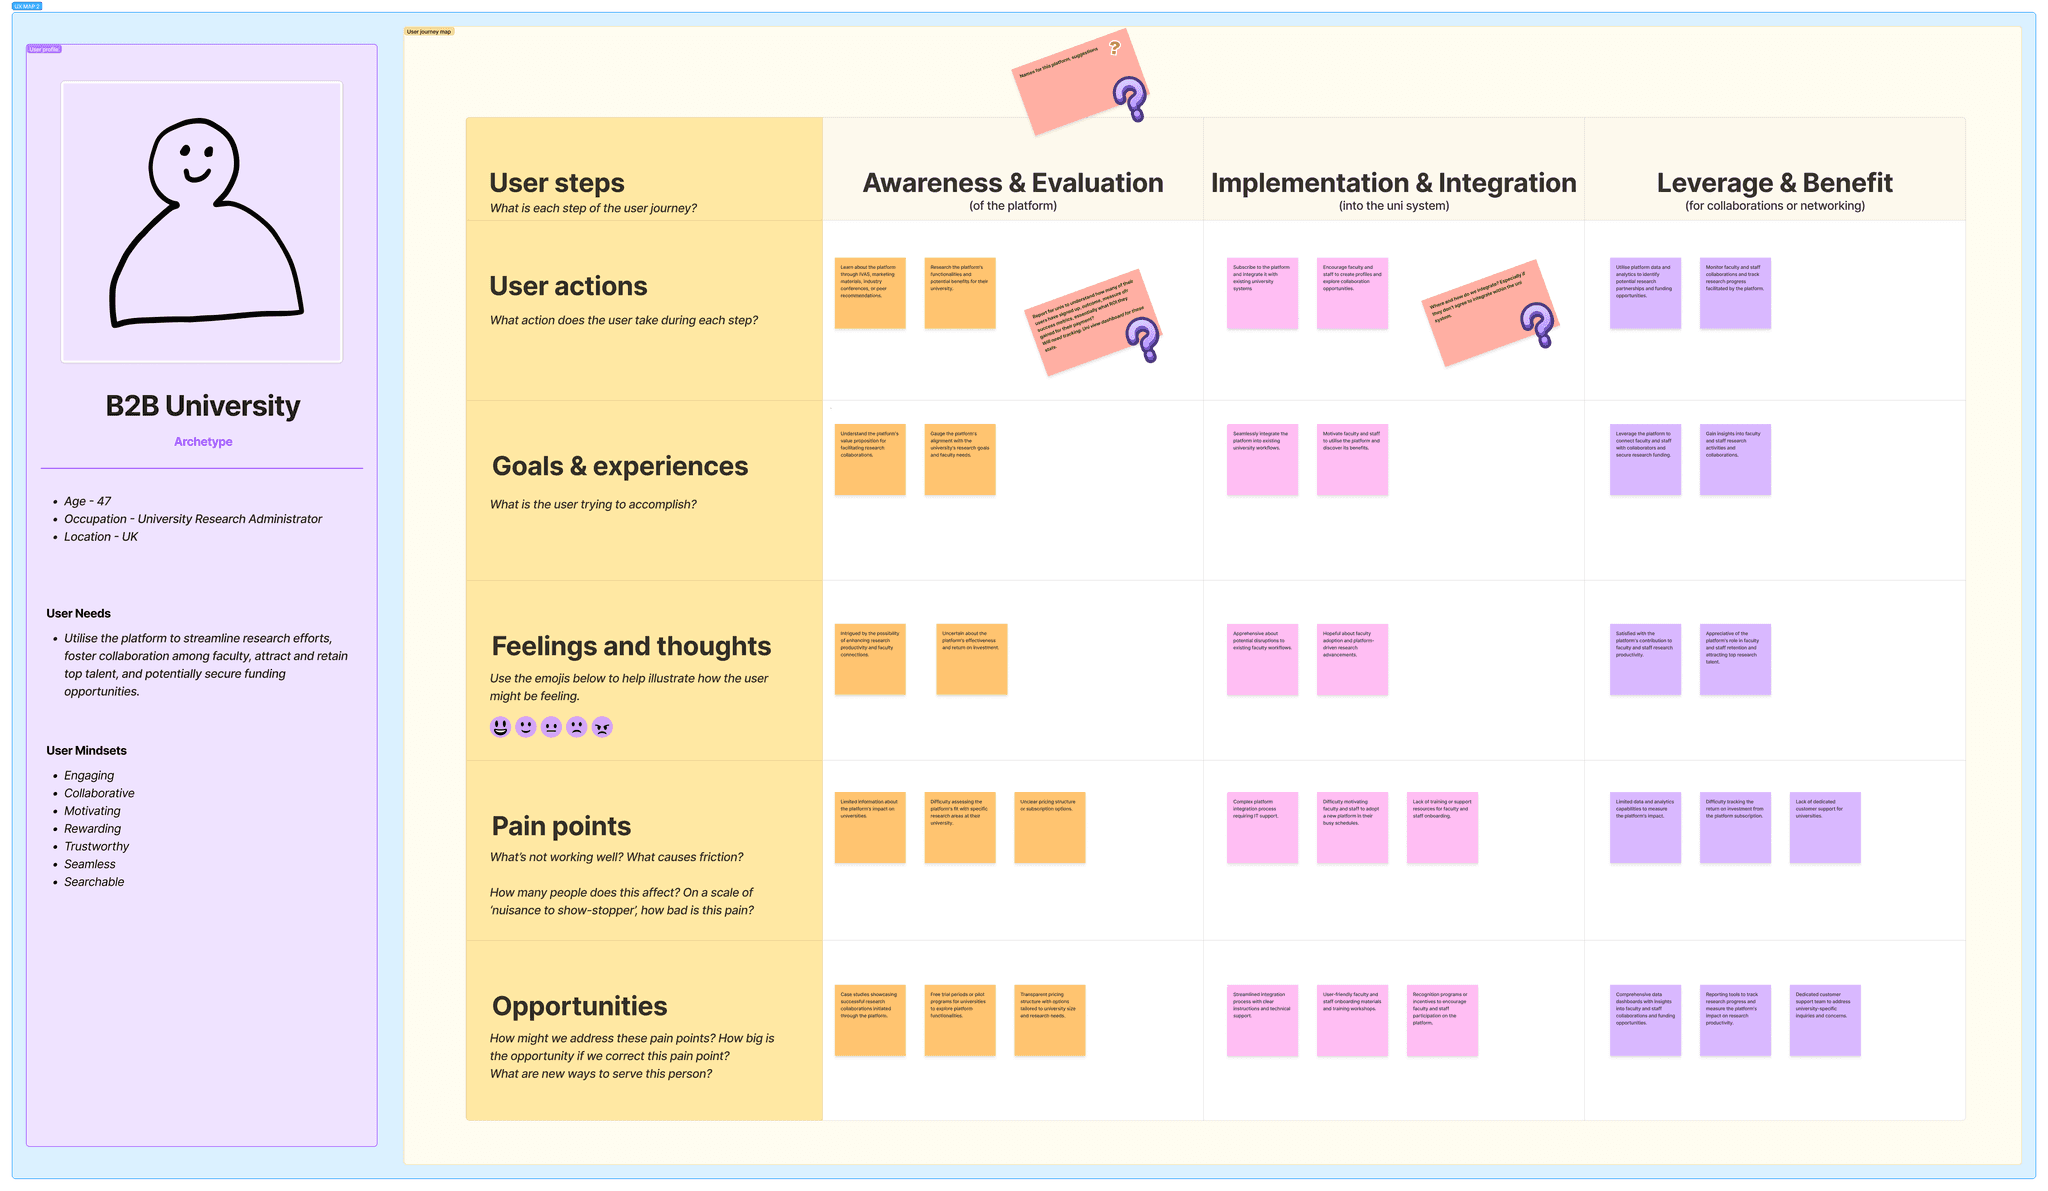
The B2B journey map that captured how they would interact with the platform
This flow balanced oversight with autonomy. Institutions didn’t have to micromanage projects but could still see the bigger picture and measure their contribution.
Contribution Flow
One of the most important pieces was making contribution frictionless. Adding a project was reduced to a short form: title, owner, description, last updated, optional artefacts. Endorsements were a single click with optional comments. The principle was simple: if sharing felt like work, people wouldn’t do it.
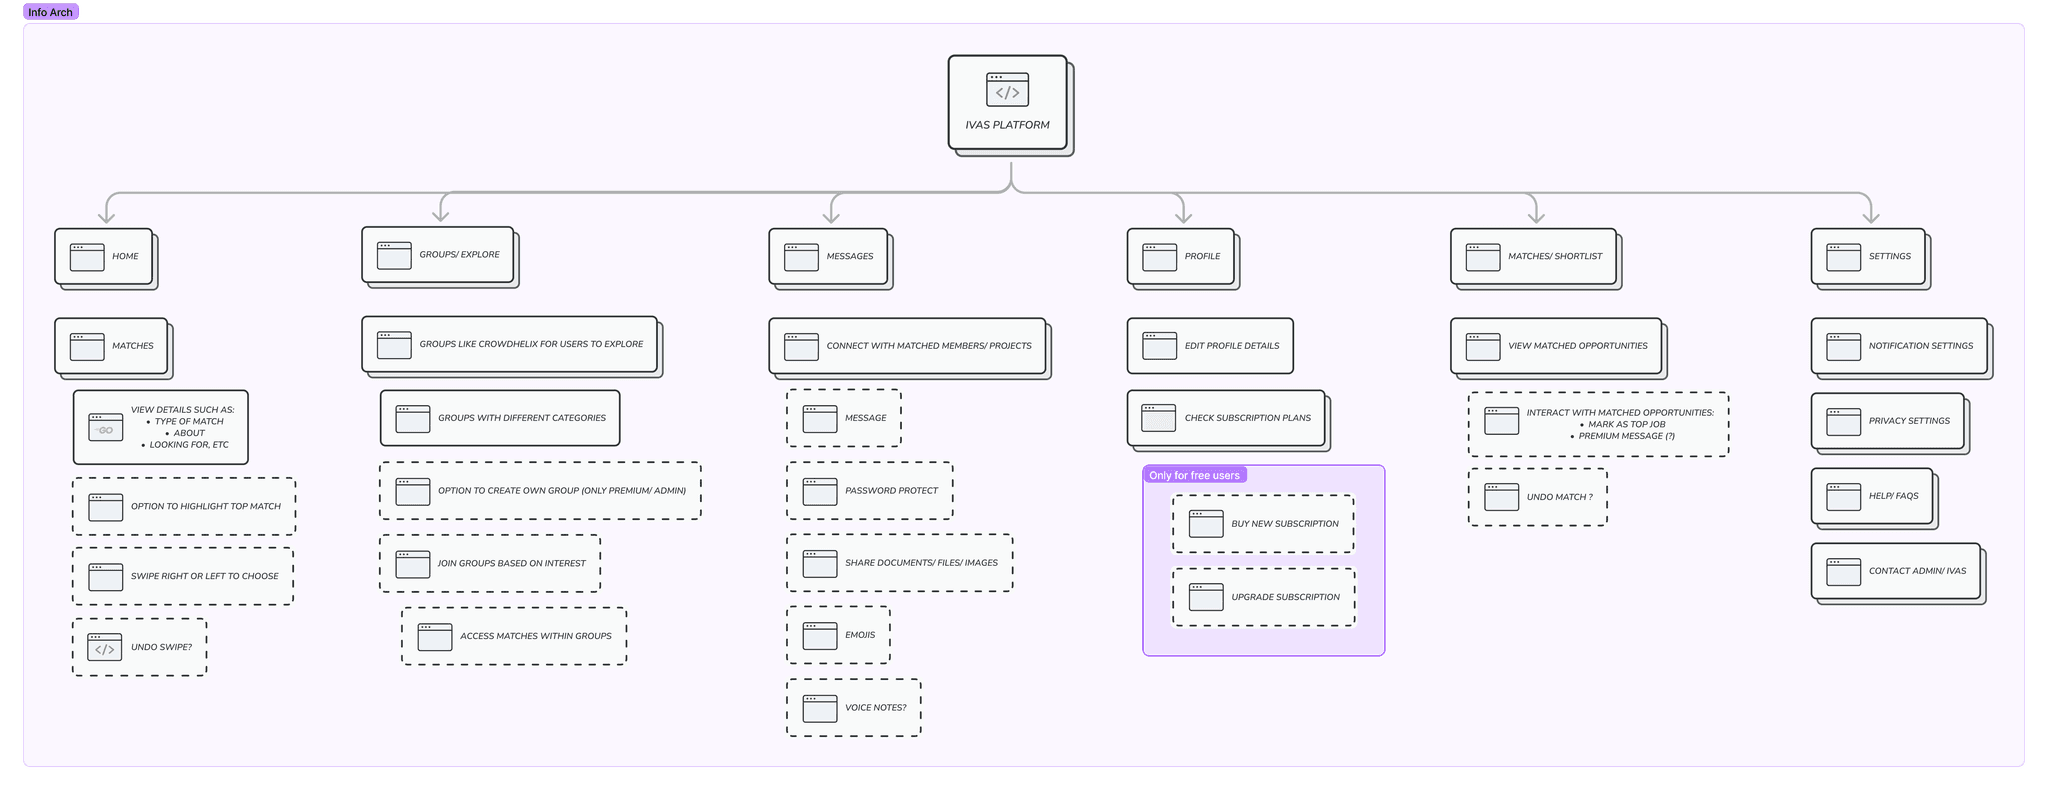
We created a flowchart to establish the information architecture of the platform
Roadmap
Once the flows were clear, the question became: what do we build first? It was tempting to try and solve everything at once, but that would have sunk the project. The founder and I worked together to shape a roadmap that was realistic and phased.
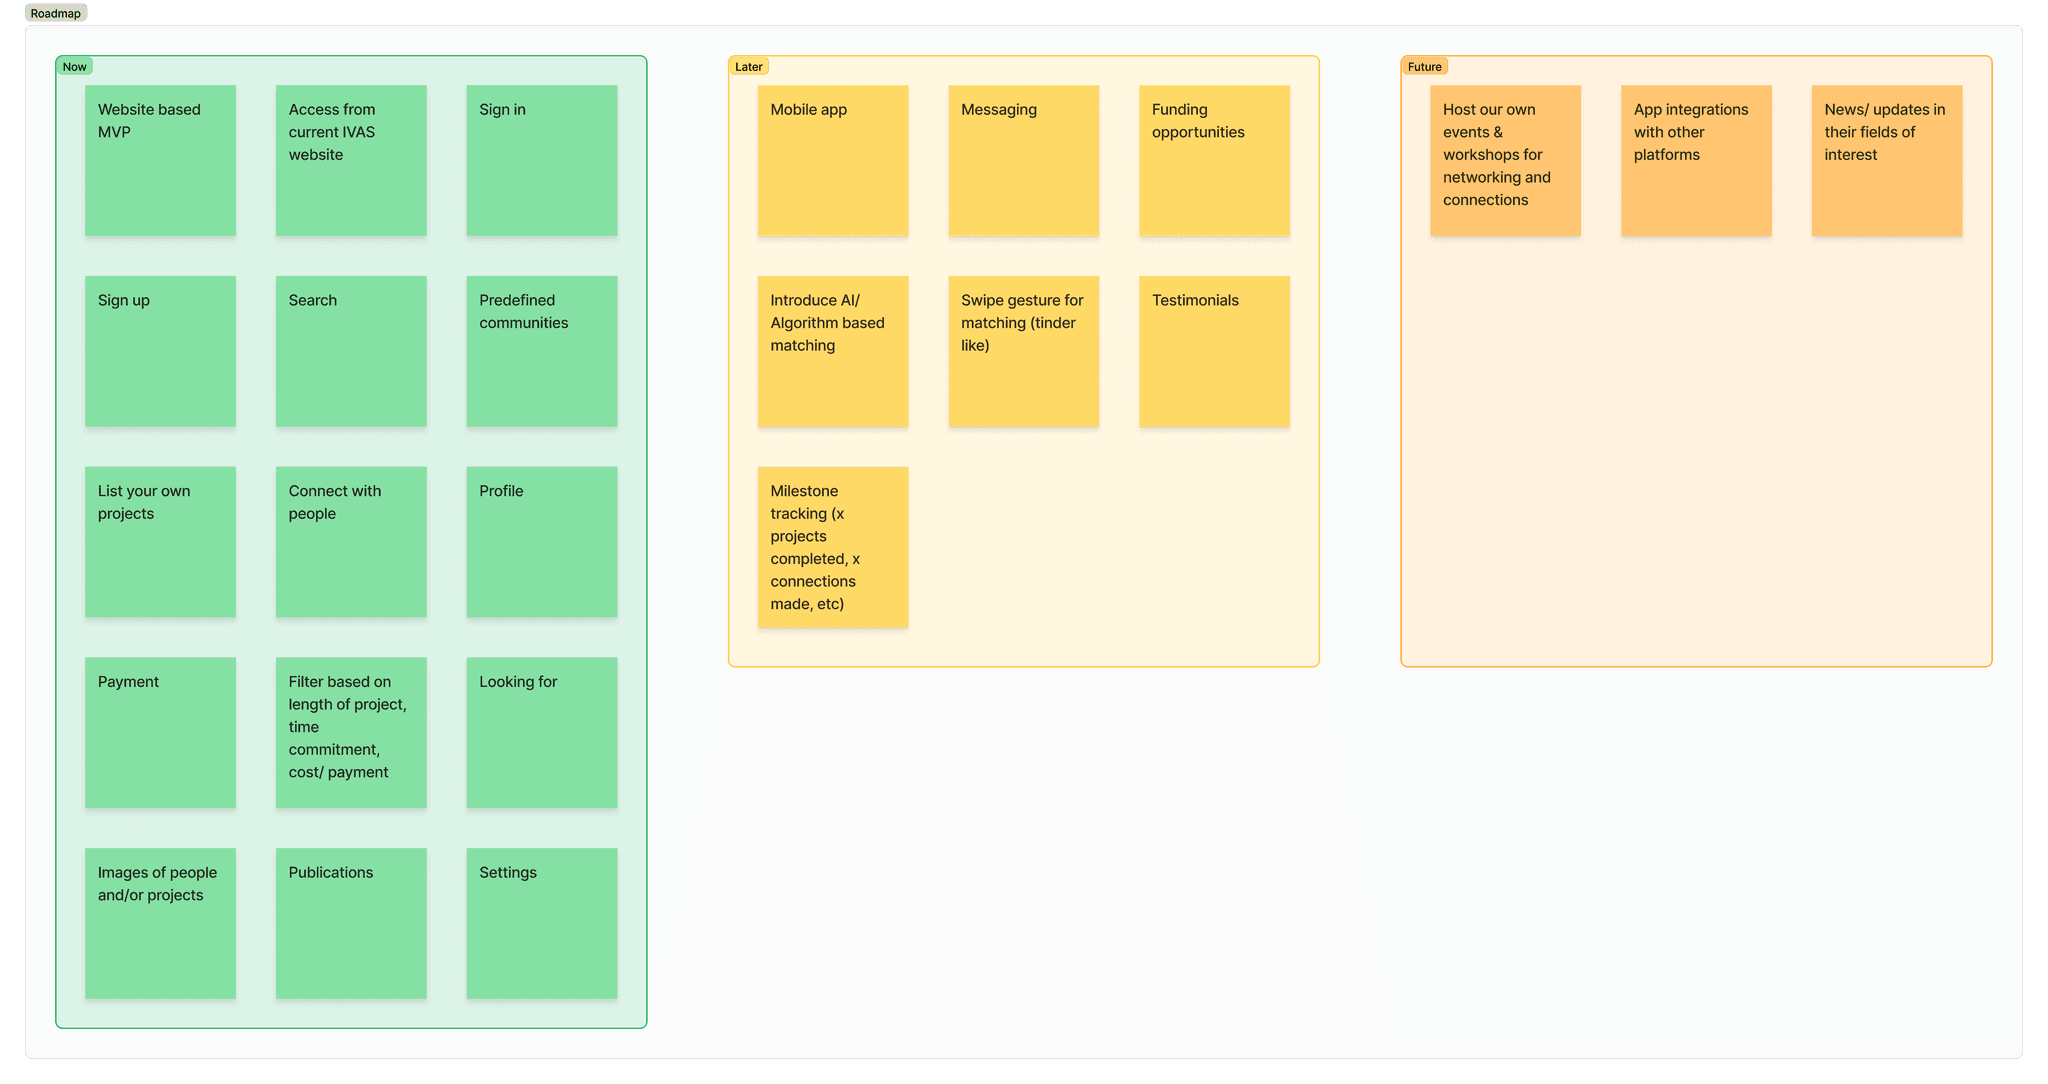
A high-level overview of the roadmap we strategised for our releases
MVP
The MVP had to prove the core cycle of visibility → trust → contribution. That meant focusing on the essentials:
A searchable directory of projects and people.
Clean profiles with ownership details.
The ability to create a project with basic context — title, description, members, last updated.
Endorsements and light-weight contribution options to encourage sharing.
This version wasn’t about polish. It was about showing that once people could find projects, trust them, and add their own, the system would start to feed itself.
Next
Once the concept was proven, the next phase would add more context and intelligence:
Richer project pages with version history, related outputs and usage stats.
Recommendation features powered by interests and skills, helping people discover work they wouldn’t have searched for directly.
Institutional dashboards so leaders could see activity across departments without micromanaging.
This phase was about depth — building confidence in the system and making it feel genuinely useful day-to-day.
Future
The longer-term vision was ambitious. IVAS could evolve into the backbone of collaboration in non-STEM fields:
Advanced reporting to demonstrate collective impact for funding bids.
Cross-institution initiatives, where multiple groups could pool projects under shared goals.
Integrations with existing academic systems to make adoption seamless.
This was the point where the platform would move beyond a directory into a genuine ecosystem for collaboration.
The roadmap was never just a timeline. It was a discipline. It forced us to strip the problem down to its core, prove that it worked, and then layer in sophistication step by step.
Outcomes
By the end of four months, we had a fully defined MVP design and a roadmap that institutions could get behind. The research, flows and IA gave us a concept strong enough to engage more than 20 institutions and 200 academics in early conversations.
For researchers, IVAS was different because it reflected their reality: small, scattered projects that needed visibility and context. For institutions, it promised oversight without bureaucracy. And for the sector as a whole, it was the first time a platform was built specifically for non-STEM academics.
Even though the project wrapped at the design stage, the outcome was more than research. It was a complete vision that showed exactly how the platform could be built and scaled.
Reflections
IVAS was a crash course in being the sole designer on a 0-to-1 product. I ran every survey, every interview, every flow, every roadmap session. Some days it felt heavy. But it also forced me to hold research, strategy and design together without dropping the thread.
What stayed with me most were the voices of the researchers. They didn’t talk in abstract terms about duplication or inefficiency. They talked about isolation. About feeling in the dark. About missing opportunities that could have changed their work. Those stories became the heartbeat of the design.
The biggest thing I learnt was that designing for collaboration is never just about features. It is about trust, visibility and recognition. If people can’t see each other, they can’t connect. If they don’t trust what they find, they won’t build on it. And if sharing feels like work, they won’t contribute.
IVAS taught me how to take a messy, invisible problem and give it structure. It showed me how to move from insight to flows to a product vision that others could rally around. And it reinforced something I now carry into every project: design isn’t just about solving problems. It’s about creating the conditions for people to change the way they work.

